Development of the Air Quality Monitoring System for the Region of Crete
The Region of Crete is another Regional Self-Government body, which chooses GET’s solutions over time and systematically invests in the development and expansion of the Geospatial Information Infrastructure through vertical applications such as GET AIR.
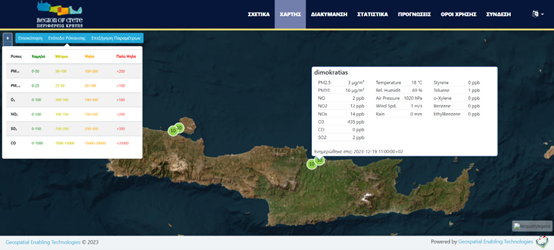
GET successfully implemented the Air Quality Monitoring System for the Region of Crete, which gives access and presents the data of the monitoring stations, in a simple and understandable way and in the form of interactive graphs and maps.
The scope of the project was the provision of digital services and the configuration of the necessary digital infrastructure for integrated monitoring and integrated management of air pollution, which the Region of Crete wishes to exercise, while complying the strategic goals set for e-Government at national and European level.
More specifically, in the framework of the project, the following were implemented by GET:
- Interconnection with stations measuring air pollution. The interface takes place at the database level or by using the API provided.
- Central storage and organization of measurements. It is done using RDBMS software and enables the export of statistics, time series and maps of measurements with different reference time periods (hourly, daily, monthly, annual). The user, after the control and quality assurance of the data by the administrators, can later download the data for processing.
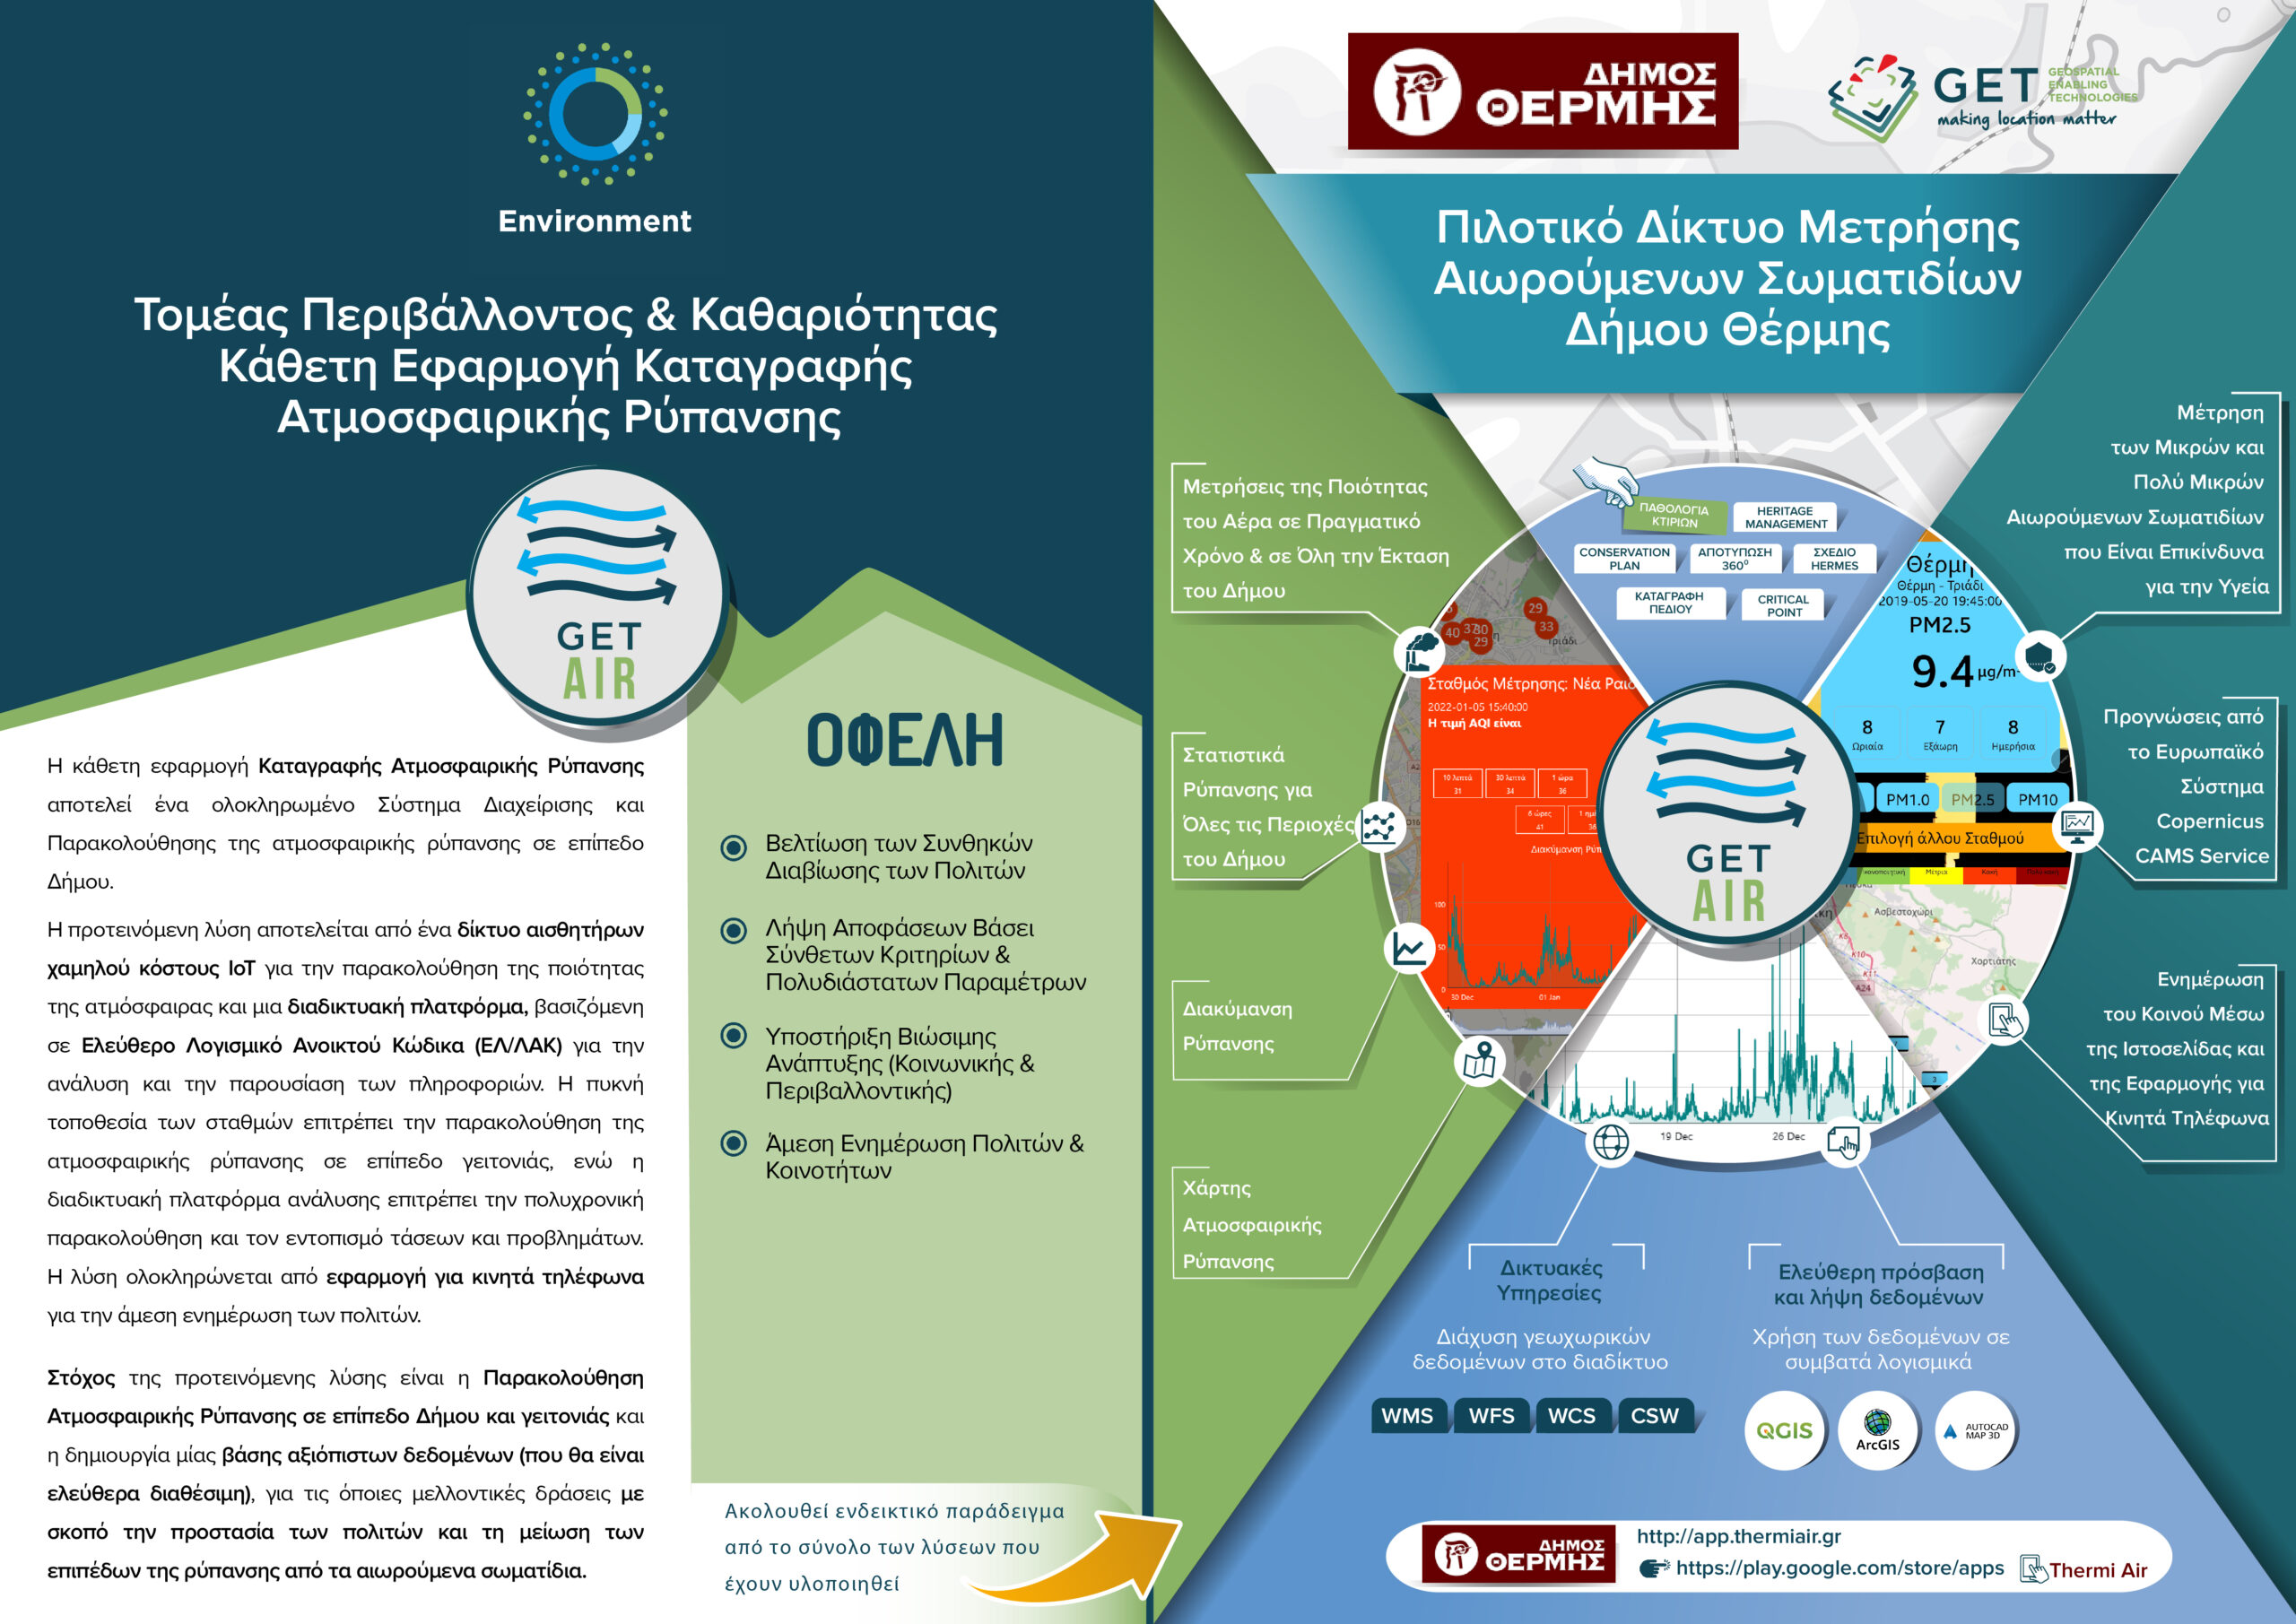
- Web application for monitoring air quality. The application enables monitoring of pollution levels at all stations of the network and for all selected air pollutants. The presentation takes place in the form of a dashboard that presents pollution levels in real time. In addition, it is possible to present the evolution of pollution over time in the form of an interactive diagram of hourly, daily and weekly values. The system also provides statistics on pollution levels at station level and comparatively for all stations. Finally, pollution levels are also presented in the form of thematic maps, where the user has the opportunity to choose the pollutant and the reference time period.
- Web application air pollution forecasting, which is based on the use of forecast data of the European Copernicus Observatory and specifically on the data of CAMS (Copernicus Atmosphere Monitoring Service). It enables the presentation of pollution levels and spatial variation for the next three (3) days per hour and per pollutant. The presentation takes place in the form of an interactive map. The application can take advantage of data of the Sentinel 5P satellite made available by the Region through electronic services.

TECHNOLOGY
- PostgreSQL
- TimescaleDB
- PostGIS
- Geoserver
- ReactJS
USEFULLY LINKS
PROFILE
Name: Region of Crete
Website: https://www.crete.gov.gr/
The Region of Crete is one of the 13 regions of Greece. It includes the island of Crete and smaller islands such as Gavdos, Gavdopoula, Zeus, Chrysi, Koufonissi and the islands of Dionysades. Its capital and largest city is Heraklion, which is the seat of the Region of Crete. Crete is the largest island in Greece and the second largest in the eastern Mediterranean after Cyprus. It is located at the southern tip of the Aegean Sea and covers an area of 8,336 km². Its permanent population is 623,065 inhabitants, according to the 2011 census, and is an important part of the economy and cultural heritage of Greece, maintaining its own cultural elements.